In 2014, A Portrait of Sonoma County successfully shifted the community’s understanding of what determines well-being and how conditions of well-being vary across Sonoma County neighborhoods.
A Portrait of Sonoma County: 2021 Update builds from this work, helping further illuminate issues of inequity across Sonoma County.
DATA TO INFORM ACTION: A MESSAGE FROM THE PORTRAIT OF SONOMA LEADERSHIP TEAM
The disparities that Black, Indigenous, People of Color, and immigrant and undocumented community members have and continue to experience should not continue unchecked or unremedied. Inequity harms everyone. From an economic perspective, inequity harms overall growth by decreasing per capita income and disposable income. On a human level, inequity damages health and well-being, resulting in greater levels of unhappiness across our entire community. A deeper understanding of the inequitable outcomes presented in this report will help communities work toward ensuring that Sonoma County is a place where race or ethnicity do not determine an individual’s health, well-being, and wealth.
Focusing on “improvements” risks hiding the very real past harms to Black, Native American, Latino, and Asian people and obscures ongoing marginalization. People living with disabilities, people who are undocumented, LGBTQ community members, and others are at risk of being left out of the picture due to inadequate data. There is more work to do locally to move beyond these pitfalls to unravel harmful narratives, to ensure that a shared understanding of Sonoma County’s well-being includes non-white perspectives, and to redouble collective efforts to improve data collection.
LEARNING FROM THE DATA
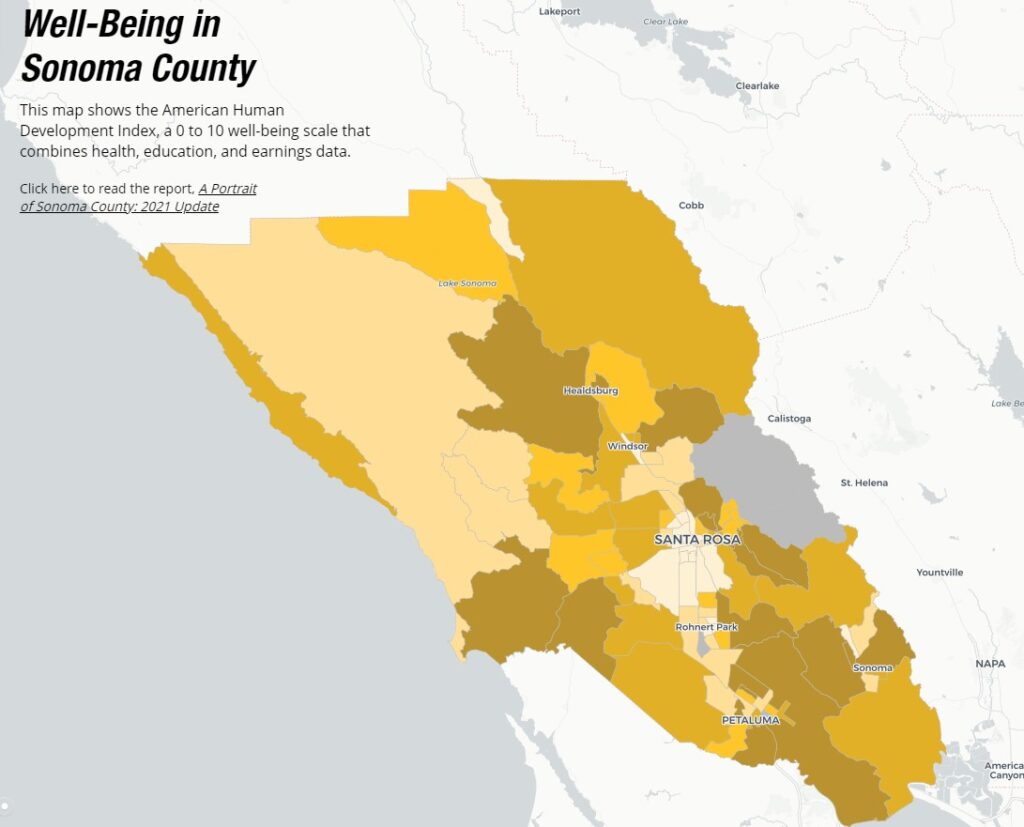
The Portrait is based on the Human Development Index (HDI), which looks at data on health, education and income as indicators of well-being for people in Sonoma County and compares across race, ethnicity, gender and geographic location. This index is designed to show that traditional measures of success, such as gross domestic product or economic prosperity, do not reflect the full picture of community well-being. Factors such as variations in life expectancy by neighborhoods and access to education are also critical to consider.
The 2021 Portrait’s findings are based on data from 2015-2019. Because 2020 HDI data was not yet available, local data were added to the new report to show impacts of the COVID-19 pandemic.

Health
- The average life expectancy in Sonoma County is 82.2 years, 1.2 years longer than the state average.
- Since 2014, life expectancy in Sonoma County has increased by 1.2 years, jumping ahead of the state as a whole, which has seen its life expectancy drop by 0.2 years.
- Among census tracts, life expectancy in Sonoma County ranges from 73.2 years in Burbank Gardens (Santa Rosa) to 86.8 years in Old Healdsburg, a difference of over thirteen years.

Education
- Despite Sonoma’s high educational attainment, there are significant disparities in degree attainment by census tract. In Sea Ranch/Timber Cove, six in ten adults 25 years and older hold bachelor’s degrees, whereas in Sheppard just over one in ten do.
- These educational disparities exist not only among geographies but also along racial lines. Only 63.8 percent of Latino Sonoma residents hold a high school diploma, as opposed to 96.0 percent of white residents. Latino residents have substantially lower rates of degree attainment than Sonoma residents of any other race. These disparities are largely due to the limited opportunities Latino immigrants had to complete their educations in their home countries. However, Latino youth are enrolled in school at rates similar to the county average: 77.1 percent are enrolled; the county average is 78.4 percent.
- Native Americans have particularly high rates of school enrollment—94.8 percent of Native American children and young people between the ages of 3 and 24 are enrolled in school. Black residents have the lowest rate of school enrollment, 69.3 percent.

Living Standards
- Overall, Sonoma County residents take home $1,000 more annually than the typical resident of California. Since the 2014 report, the earnings of Sonoma County residents have increased by about $7,000 (adjusted for inflation).
- Despite having higher Education Index scores, women earn much less than men, with men taking home $11,500 more than women in Sonoma County. This gap has widened since the last report, when men in Sonoma made $8,500 more than women. For all racial and ethnic groups except for Native Americans, men earn more than women.
- In Sonoma County, white residents earn over $15,000 more than Latino, Native American, and NHOPI residents.
- Among census tracts, median earnings range from $16,500 in the Rohnert Park B/C/R Section to $72,400 in East Bennett Valley (Santa Rosa).
A NEW AGENDA FOR ACTION
This updated Portrait of Sonoma County report marks the beginning of a renewed community conversation, not the conclusion. The voices and input of community members must guide collective response to the report’s findings. Beginning in early 2022, community members and local leaders will come together to create a new Agenda for Action.
The Agenda for Action is a set of strategies and solutions prioritized around issues causing the greatest harm in communities. Identifying these shared priorities is intended to lead to greater shared investment in and support for creative solutions. Only together can the community shift resources and power to people who have solutions that will work for them. Only together can the community create an Agenda for Action that drives meaningful policy and systems change toward dismantling structural racism.
Working together to refocus on lagging areas and set new priorities rooted in post-pandemic realities is the work that lies ahead. This time, instead of government leaders prescribing an Agenda for Action, local leaders and community members—especially those who belong to communities most impacted by issues and challenges in Sonoma County—will work together to create the new Agenda for Action.
PRODUCED BY
Measure of America with the Sonoma County Office of Equity, Upstream Investments, Sonoma County Departments of Health Services and Human Services, and community partners.
Portrait Sponsors








This update of A Portrait of Sonoma County was made possible thanks to funding from Community Foundation Sonoma County and the Peter E. Haas Jr. Family Fund as lead funders, with additional support from Career Technical Education Foundation, First 5 Sonoma County, Healthcare Foundation Northern Sonoma County, John Jordan Foundation, Kaiser Permanente, Petaluma Health Care District, Sonoma County Grape Growers Foundation, Sonoma County Office of Education, Providence St. Joseph, Sutter Health, and United Way of the Wine Country. Thank you for making this investment in Sonoma County.

