In 2014, we helped develop The Portrait of Sonoma, a groundbreaking study which collected and interpreted census data to illuminate issues of inequity. Using the American Human Development Index (HDI) measurements of health, wealth, and education, the study compares race, ethnicity, gender, and geography data.
The Portrait of Sonoma provided a detailed picture of where disparities persist in our county. The goal was powerful; by showcasing where our community is falling behind, philanthropic funders, government agencies, and community groups could coordinate to offer targeted intervention where it was most needed.
The report helped to shift our understanding of what determines well-being and brought the issues of inequity to new light.
Six years later, following fires and the pandemic, Ralph Lewin, executive director of the Peter E. Haas Jr. Family Fund, approached us about co-funding an updated Portrait to inform future efforts to effect change in the community.
“These projects are not easy lifts—they take a lot of coordination and leadership,” Ralph says. “One of the roles the Community Foundation plays is being a galvanizer of the philanthropic field. CFSC used the trust they’ve built over decades to call on other funders to help support this effort. In the end, the Community Foundation and the Peter E. Haas Jr. Family Fund were the lead funders, and 11 other important funders joined. To me, it’s a testimony to the Foundation’s capacity to galvanize the philanthropic community for good.”
WHAT THE DATA SHOWS
The resulting Portrait of Sonoma County: 2021 found Black, indigenous, people of color, and immigrant and undocumented community members are continuing to experience deep disparities across health, wealth, and education levels across the county. While there were some areas of improvement compared with 2014, the updated metrics make clear that there can be no progress without all members of our community progressing together.
For example, only 69.3% of Black youth are enrolled in school compared to 77.1% of Latino youth and 87.8% of Asian youth.
While the gap between neighborhoods with the highest and lowest life expectancy has narrowed since 2014, people living in the highest-scoring neighborhood, East Bennett Valley, still live 8.7 years longer than those in the lowest-scoring Roseland neighborhoods.
AN INCLUSIVE AGENDA FOR CHANGE
Understanding the data is just the first step toward meaningful change. We also need community input to develop an Agenda for Action guided by community voices. Together, the portrait and the Agenda for Action will help our community direct resources toward sustainable, meaningful solutions to the problems causing harm in our county.
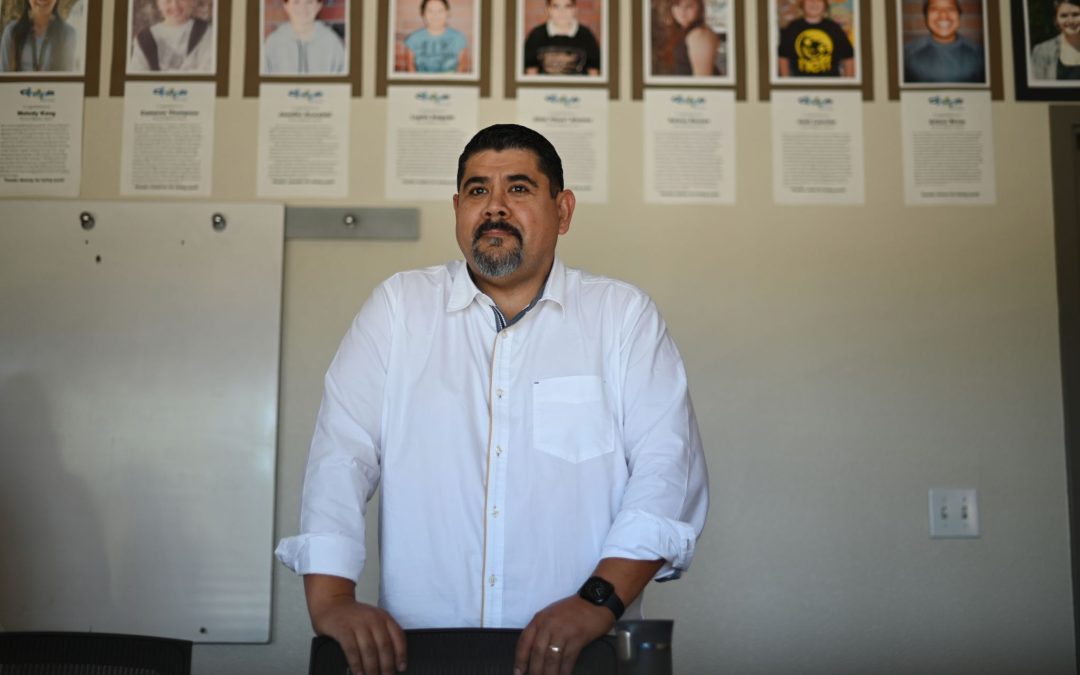
“It is a key equity principle that folks living these challenges are also closest to the solutions,” says Alegría De La Cruz, director of the Sonoma County Office of Equity. “They have likely spent some time reflecting on the strategies and supports that could increase the quality of the services their lives, and our work will lift up those solutions.’”
“We are now supporting a community-based approach to design how we will move forward with an Agenda for Action,” Ralph says. “What’s beautiful is there is a [public–private] collaboration already in place called Health Action, which includes partners that have been involved with Portrait of Sonoma. Together we can support community conversations to create a more inclusive Agenda for Action.”
Much of the community conversations will involve going into the communities with the lowest HDI scores and convening focus groups to ask our neighbors direct questions, such as: “Does this data reflect your life? If so, why and how? How can we learn from you what strategies we need to implement to change these outcomes?”
“We need to make sure we’re ground-truthing the data with qualitative information from communities. Traditional data practices can erase community members who experience marginalization, and we want to make sure what we collected and reported is consistent with their experiences,” Alegría says. “And then as they get deeply engaged in that data, saying to them, what do you want us to do together to make real change?”
“By asking people to tell us the story behind the data, we can dig deeper into the solutions,” says Karin Demarest, CFSC’s vice president for community impact. “Community members might say, ‘I can’t go to the doctor, get my kids’ teeth fixed, or afford healthy foods because all my income goes to housing.’ In a report, shown only in data, this could come across as a health issue, when in reality, it’s also showing us that we need to address the housing issue in our community, we could free up some of their income to meet other basic needs.
“These conversations will be about identifying the catalyzing actions we can take as a community to change this data in the future. We’re trying to shift the influence of power to the communities to help inform us about what we should do to have an impact.”